





Better Approval Visibility: Approval Path for Jira Comes to Your Jira Dashboard
Approval workflows are made to define what needs to happen next: Who needs to approve? In what order? Under which conditions? What happens after a decision?
But even the best-designed process can slow down for a very ordinary reason: someone simply doesn’t notice that an approval is waiting for them. A request sits pending. Someone asks for an update, and another person checks whether the approver has seen it. A perfectly structured workflow suddenly involves a surprising amount of chasing.
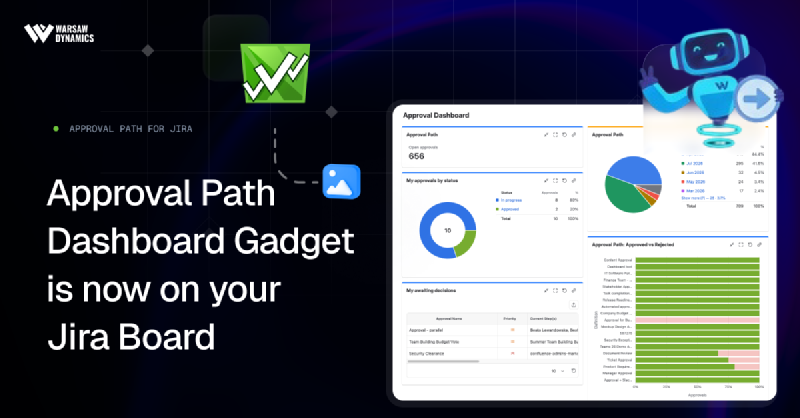
That is exactly the gap we wanted to close. With the new **Approval Path for Jira dashboard gadget **, approvals become much easier to see and act on. You can bring personal approval queues, process overviews, charts, KPIs, and approval trends directly to a Jira dashboard - giving approvers, teams, and process owners better visibility into what needs attention and how approval processes are performing.
When approval work is visible, it is easier to move
Jira dashboards are often the first place teams look to understand what is happening. They are much more than a personal reporting space: in many organizations, they become a shared operational view across projects, teams, and processes. That company-wide visibility matters because many delays are not caused by missing data, but by information being hard to find at the right moment.
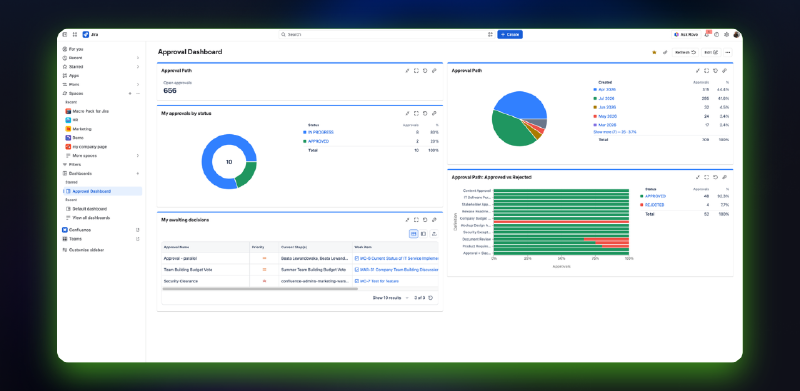
When important signals appear on the dashboards people already use, they are easier to notice, discuss, and act on. That was our primary line of thought when creating the Approval Path dashboard gadget. Teams often search for what is open, what is blocked, and how much work is in progress - approvals deserve the same visibility: what waits for approval, how long an approval takes, and whether someone is overwhelmed by being a solo approver (as shown in the example below)
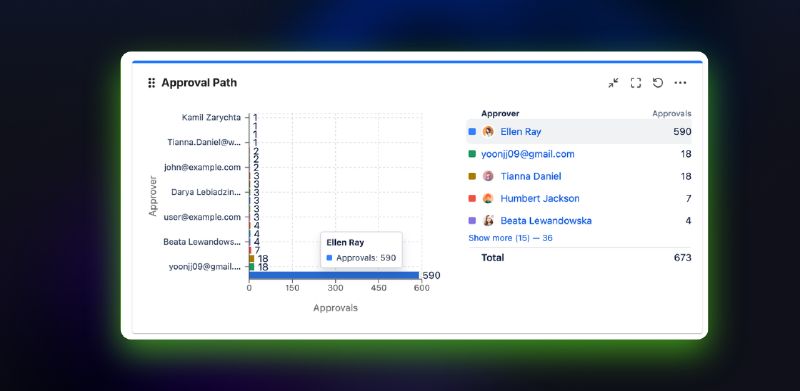
Instead of relying entirely on notifications or remembering to check an approval separately, users can now see relevant approval activity when they open their Jira dashboard. And depending on what you need to understand, that view can look very different: you can create a straightforward table of approvals waiting for action, or a KPI showing how many approvals remain open. Or a chart showing approval outcomes, workload across approvers, or how long different processes take to reach a decision.
In other words, this isn’t only a new place to display approvals; it’s a way to make the approval process easier to understand and faster to react to.
Your personal approval queue, without the hunting
For an approver, the most useful dashboard can also be the simplest one:
What needs my decision?
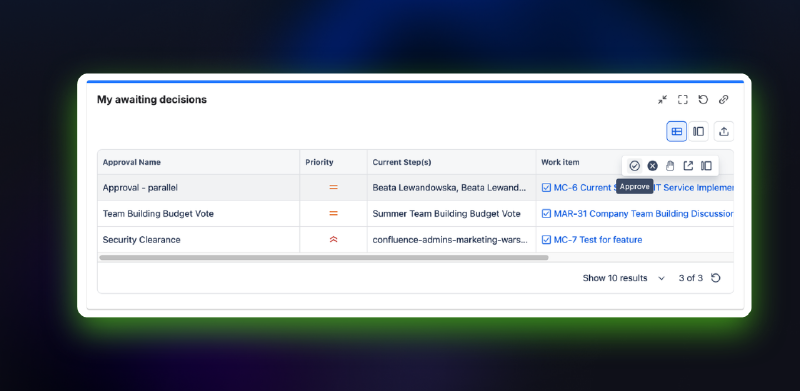
Approval Path includes a ready-made Approvals awaiting my decision template that shows each viewer the approvals currently pending their decision, with the closest decision deadlines first. The result is essentially a personal approval to-do list inside Jira.
From there, approvers can open the relevant work item or approval and make their decision. When an approval requires action, the gadget provides an action button that opens the Jira work item with the Approval Path window ready. The dashboard remains open, making it easy to move through several outstanding approvals one after another.
That removes several small pieces of friction that add up surprisingly quickly.
Instead of:
Receive notification → Remember to come back to it later → Find the work item → Locate the approval → Take action
The route becomes much shorter:
See pending approval → Open it → Decide
The same dashboard can mean something different to every viewer
There is another important detail about the gadget: the dashboard can be shared, but the approval data remains personal to the person viewing it. The gadget configuration is created once, while the actual approval data is calculated for each viewer.
So if you create a shared gadget that shows Approvals awaiting my decision, you don’t need a separate version for each approver. Each person opening the dashboard sees their relevant approvals - Approval Path applies each viewer’s permissions before displaying the data, so people only see the approval information available to them.
That gives teams an interesting combination: shared visibility without shared oversharing.
A Jira dashboard can become a common place for tracking approval work without turning it into a shortcut around Approval Path permissions.
Zoom out from individual approvals to the whole process
The personal queue solves one problem: What do I need to act on?
But once approval information reaches the dashboard, you can start asking much bigger questions:
Where are approvals getting stuck?
Which processes generate the most approval work?
Are some approval definitions taking considerably longer than others?
Is our approval queue growing faster than we’re resolving it?
Where is the current approval workload concentrated?
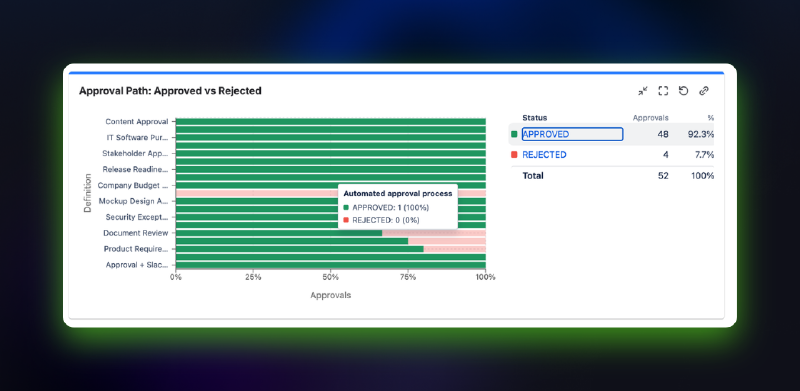
The gadget supports tables and aggregated tables, as well as pie, bar, and line charts, and KPI stat tiles. Approval data can therefore be presented not only as a list of individual requests but also as an overview of how a process behaves over time. Depending on the chart type, you have a set of configuration tabs like Source, Calculations, Format, etc., each one answering a specific question. For example, you can count approvals, or measure how long they take, how late they run, or how often they land on time.
If one part of the process is becoming a bottleneck, you have a much better chance of noticing it before the traditional project-management technique of someone asking in Slack what is taking so long kicks in.
Better visibility can mean better collaboration
Approval delays rarely affect only the approver: a budget decision may hold up purchasing; a content
approval may delay publishing; a project sign-off may prevent another team from starting their part
of the work (a marketing approval may delay your Atlassian Team booth graphics, and we know how this
ends  )
)
That means the cost of an invisible approval often spreads beyond the person responsible for making the decision. Making approval activity easier to see gives teams a clearer shared picture of where things stand, and team members spend less time asking “Has this been approved yet?”
Approval Path lets dashboard editors start from ready-made My Work or Process Overview templates, or build a gadget from scratch. Sources can then be narrowed using filters such as approval name, definition, status, priority, Jira space, or JQL. A live preview shows how the gadget will look while it is being configured. The display can then match the question you actually want the dashboard to answer - whether that’s a detailed approval table, a visual trend, or one important number you want everyone to notice.
And when the right people can see what is waiting, what is moving, and what is slowing down, approvals have a much better chance of doing what they were designed to do in the first place: help work move forward.
Ready to bring Approval Path to your Jira dashboard?
Add the Approval Path dashboard gadget to your Jira dashboard, choose one of the ready-made templates or create your own view, and start turning approval activity into something your team can see and act on.
Read documentation on how to set up the Approval Path dashboard gadget or watch our short video tutorial .